How to Annotate a Website: Notes, Feedback and Bug Reports
To annotate a website, match the method to the job. For notes that stay on the page, use a highlighter extension such as Hypothesis. For team comments pinned to live elements, use a feedback tool like Markup.io or BugHerd. To explain a bug or a change, capture the page and mark it up with numbered steps, arrows and text.
Most guides on how to annotate website pages cover only one of those jobs, usually the one their product sells. This guide covers all three, the free tools already on your computer, and the habits that make feedback easy to act on. If you mostly mark up images, the best markup tools roundup compares the apps.
| Job | Method | Example tools | Output | Stays on the page? | Install or account? | Works on logged-in staging? |
|---|---|---|---|---|---|---|
| Keep research notes | 1. Highlight and note | Hypothesis, save as PDF | Highlights and notes | Yes, until the text changes | Extension and a free account | Yes, in your own browser |
| Collect team or client review | 2. Pin live comments | Markup.io, BugHerd, Pastel | Comment threads on elements | Yes, inside the tool | Accounts, often paid per seat | Script or extension: yes. Proxy link: often no |
| Report a bug or ask for a change | 3. Capture and annotate | Built-in screenshot tools, a screenshot app | One annotated image | No, it is a snapshot | Just a capture tool | Yes, with a scrolling, region or window capture |
What it means to annotate a website
The W3C Web Annotation Data Model describes an annotation as a link between a body, such as a comment, and a target, such as one part of a web page. In plain terms, you attach a note to a spot so someone else knows exactly what you mean.
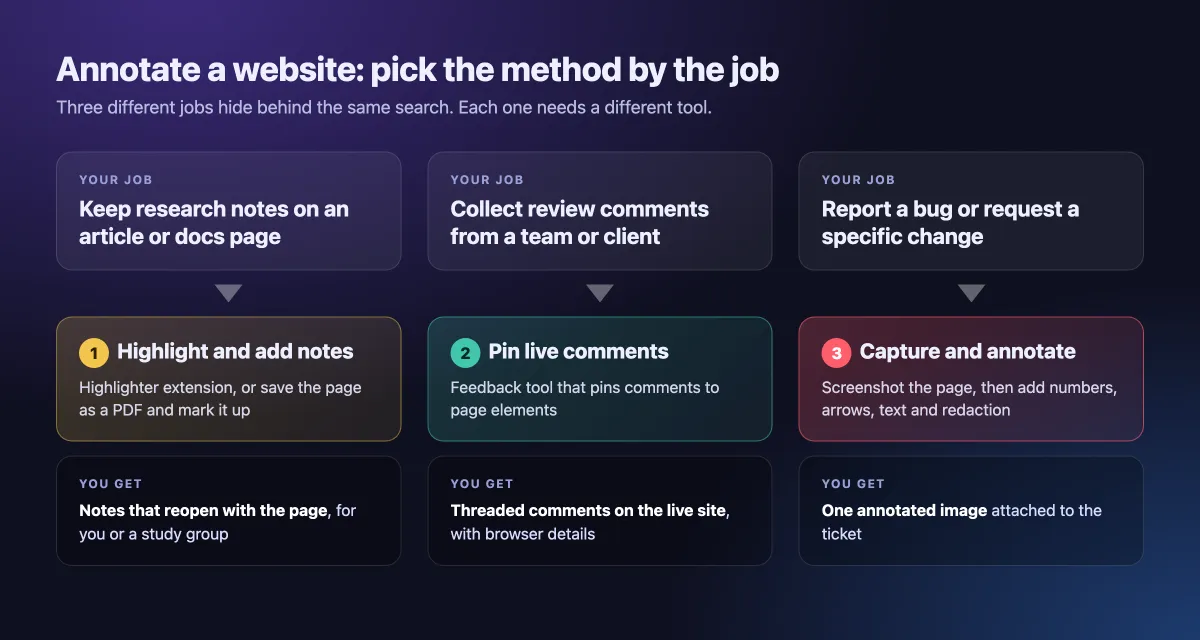
Three different jobs hide behind that idea:
- Research notes. You highlight and comment on articles or docs, for yourself or a study group.
- Live team comments. Reviewers pin comments to buttons and headings on a site under review.
- An annotated snapshot. You capture the page and draw on the image for a bug ticket, a change request or a doc.
If a search assistant asks whether you are studying or giving web design feedback, this is the split it means. Students want Method 1. Teams in review rounds want Method 2. Testers and developers filing tickets want Method 3.
Method 1: Highlight and add notes on a web page
This is the research job. You want notes that come back when you open the page next week.
Use a highlighter extension
Hypothesis is the best-known open option, and its free account covers personal use and groups. Most highlighter extensions work the same way:
- Install the extension in Chrome, Edge or another Chromium browser. In Firefox and Safari, drag the bookmarklet to your bar.
- Sign in, open the page and turn the extension on.
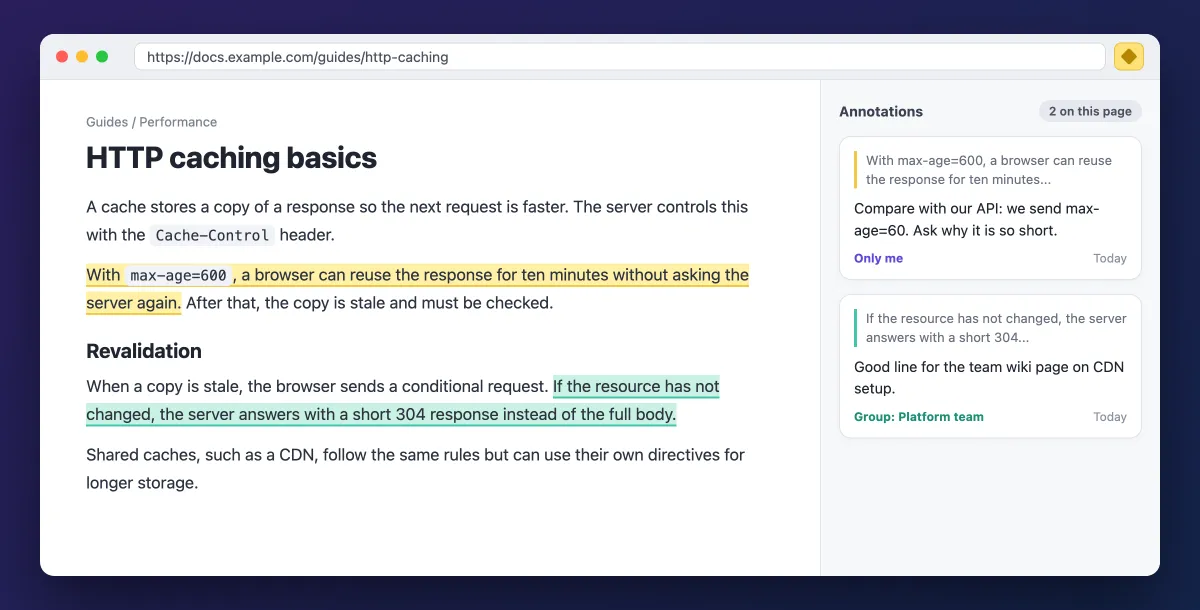
- Select text, then choose Highlight for a quick mark or Annotate to add a note.
- Post the note to Only Me, a private group, or the public layer.
Open the same URL later with the extension on, and your notes load in a sidebar.
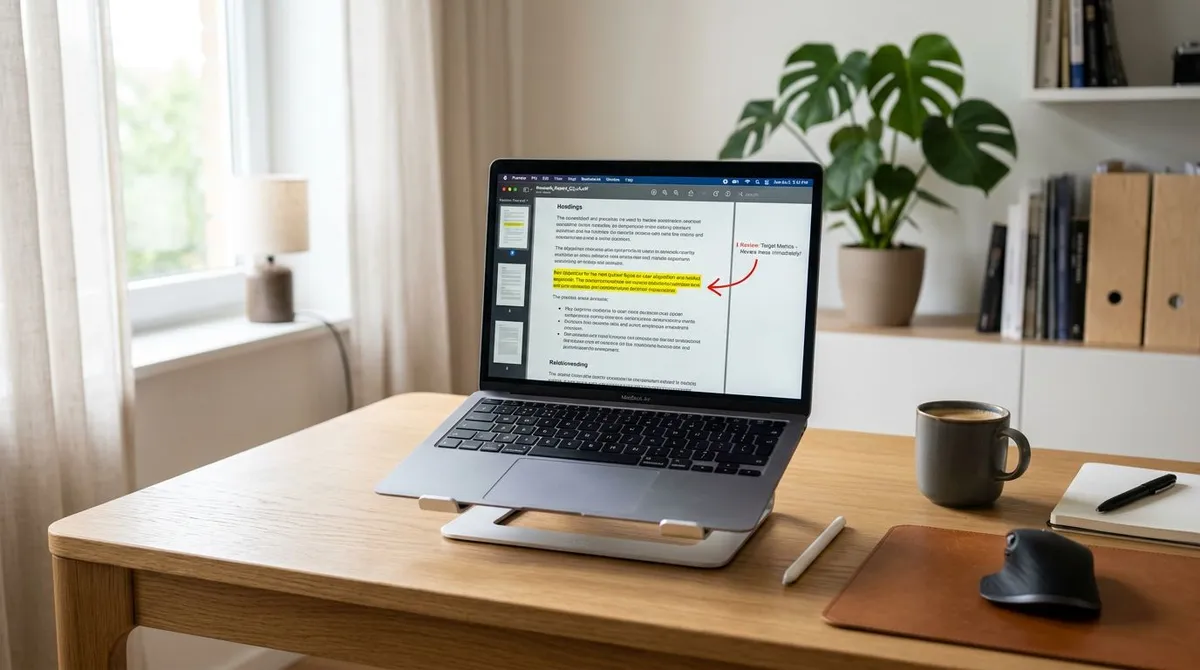
Save the page as a PDF and annotate it
If you cannot install extensions, turn the page into a file. Press Ctrl + P (Cmd + P on Mac), set the destination to Save as PDF, and save. In Safari on Mac, use File > Export as PDF.
Then mark up the PDF in Preview on a Mac or in Microsoft Edge on Windows. The guide to annotating a PDF covers the tools. A PDF is a frozen copy, so it also records what the page said on that day.
Limits of the research method
- Notes can get lost. Highlights anchor to the page text. When that text changes, a note can lose its spot.
- Some pages block extensions. Browser settings pages, extension stores and often the built-in PDF viewer do not allow them.
- Only people using the same tool see the notes. A colleague without the extension sees a clean page.
Method 2: Pin live comments on a website for team review
Website feedback tools let reviewers click an element on a live or staging site and leave a comment on it. The tool saves the comment with a screenshot and browser details, then sends it to a task board.
They connect to your site in one of three ways:
- Browser extension. Fast for internal teams. Clients have to install it, and it only runs on desktop.
- Proxy link. You share a special URL that loads your site inside the tool. Nothing to install, but it often fails behind logins, VPNs or basic auth.
- Script snippet. You add one line of JavaScript to the staging site. Reviewers need nothing extra, and it works on phones.
The flow is the same everywhere: open the site or paste its URL, click the element, then write and assign the comment.
Options include Markup.io, BugHerd, Pastel and AnnotateWeb. AnnotateWeb's own site says its notes delete after 2 minutes of inactivity, so it suits quick live sessions, not lasting notes.
The trade is clear. You get element context and browser data for free, but you pay with accounts, per-seat plans and setup time for clients. For long client review rounds, that is often worth it. For one bug in one ticket, it rarely is.
Method 3: Capture the page and annotate a screenshot
This is the job most developers and QA engineers have, whether in daily exploratory testing or a team bug bash. You need to show what is wrong on one page, in one image, so nobody needs a call. Six steps cover it.
Step 1: Capture the full page or the exact state
Pick the capture by where the page lives:
- Public pages. Use a URL-based full-page capture and pick the viewport where the bug shows: desktop, phone or tablet.
- Logged-in staging, localhost, VPN or intranet pages. Use a scrolling, region or window capture of your own browser. URL capture tools render the page on a remote server, so they never see your session or your network.
- Hover states, open menus and modals. Capture your own screen while the state is visible, often with a timer.
For the capture itself, see the full-page guides for Mac and Windows, or the ways to screenshot a webpage on Windows.
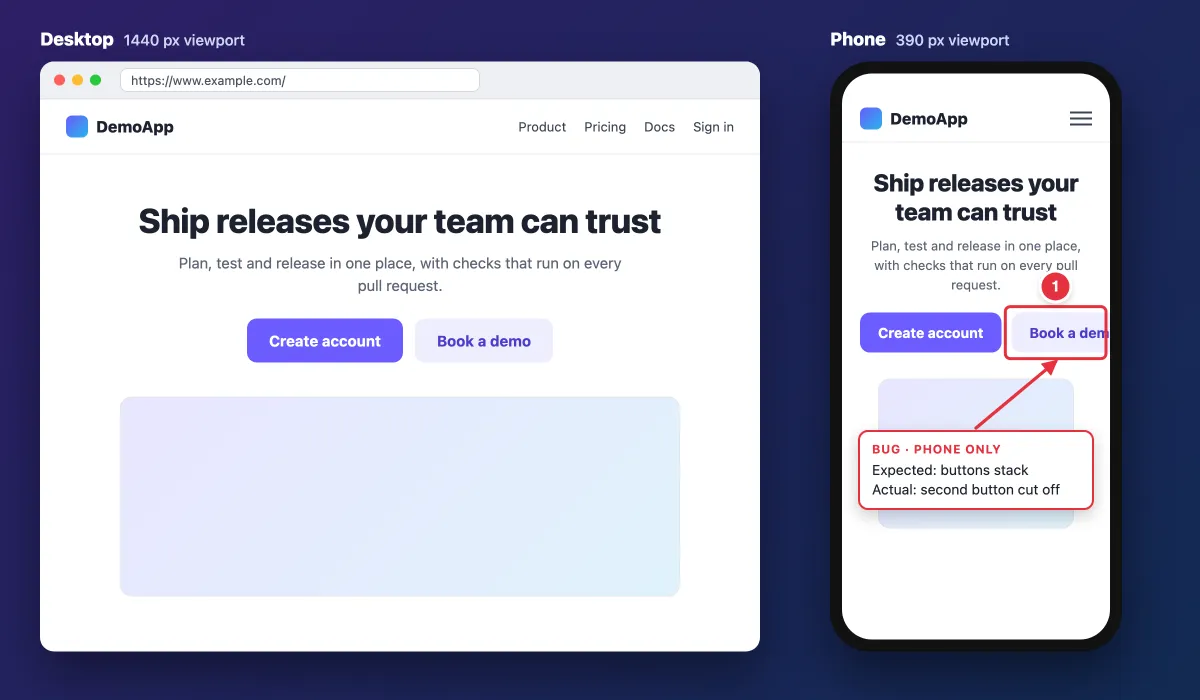
Layout bugs need the right width. A page that looks fine at 1440 pixels can break at 390, so capture the viewport named in the bug.
Step 2: Number each issue with counter markers
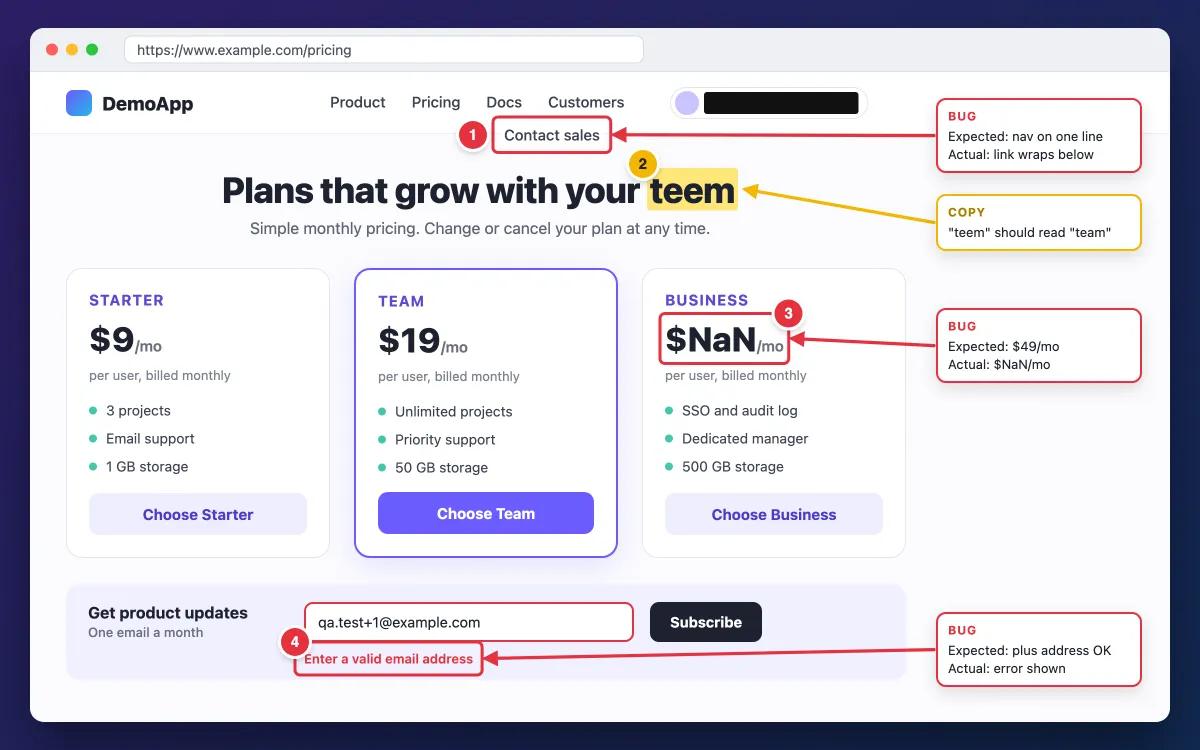
Drop a numbered marker (1, 2, 3) on each problem. Then write a numbered list in the ticket with the same numbers. "Fix 3" is faster to say than "the price in the card on the right."
Step 3: Point with arrows, boxes and highlights
Draw a box around the element, add an arrow when the target is small, and use a highlighter on wrong text. Keep one meaning per color: red for bugs, yellow for copy changes. The technique guides for Mac and Windows go deeper.
Step 4: Add short callouts as expected vs actual
Each callout gets one line for the expected result and one for the actual result. "Expected: $49/mo. Actual: $NaN/mo" leaves nothing to guess. Keep each callout under 15 words.
Step 5: Hide personal data and secrets
Cover names, emails, order IDs and card digits with a solid opaque box. Do the same for API keys, tokens, passwords and session IDs. Blur and pixelation can be reversed on text, as the guide to redacting text safely explains.
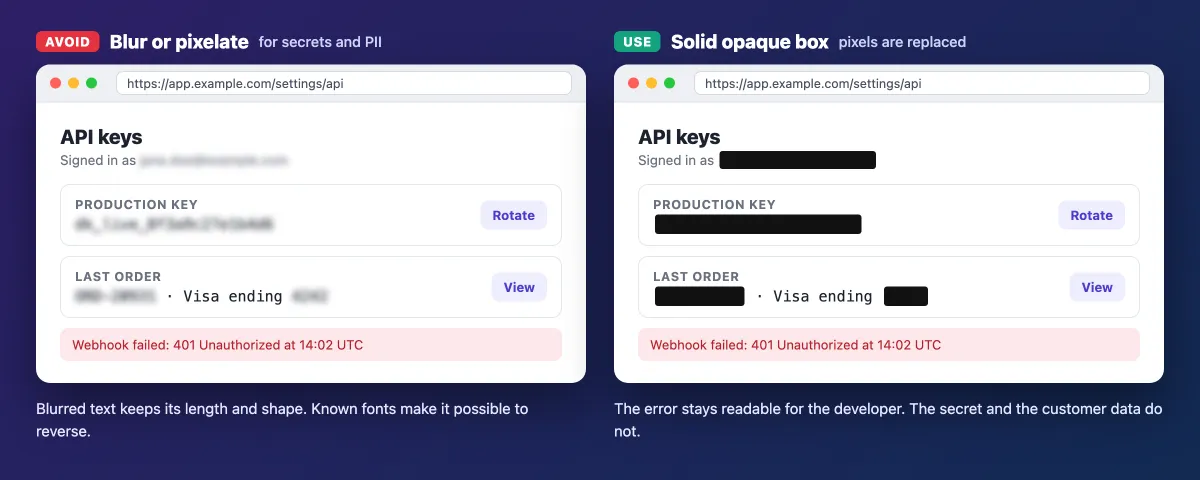
Save blur and pixelate for low-risk details, like an unrelated tab name or a face in a stock photo. Leave the error message readable, though: the developer needs "401 Unauthorized," not the key behind it.
Step 6: Share it where the work happens
Paste the image into the Jira issue, GitHub issue or Slack thread where the fix will be tracked. Then attach the image file to the ticket, so it lasts as long as the ticket does. Both GitHub and Jira accept drag and drop, and the Jira screenshot guide covers the rest.
A cloud share link is fine for a quick look in chat. Uploads are removed periodically, so keep share links out of tickets and docs: the attached file is the record. More options are in the guide to sharing screenshots on Windows.
When a still image is not enough
Hover effects, animations and broken multi-step flows need motion. Record a 5 to 15 second GIF or video that shows the steps once, and attach it next to the annotated image. The GIF guides for Mac and Windows show how.
Doing Method 3 in one app
ScreenSnap Pro pairs URL full-page capture with the annotation tools above, on Mac and Windows. Paste a public URL, then pick full page or first screen and a desktop, phone or tablet preset. It loads lazy images and blocks most cookie banners and ads.
It renders the page on a server, so it needs an internet connection and only reaches public pages. For logged-in staging, use its Scrolling Capture on your own browser window. Also, do not paste URLs that carry secrets, such as signed links or magic-link tokens.
After capture, the counter, arrow, rectangle, highlighter, text and filled rectangle tools cover steps 2 to 5. OCR copies an error message into the ticket, and you can pin the spec image over the live page while you compare. The result is a static image, not live comments: there is no browser extension or team commenting, so teams that need threaded review on a live site should use a Method 2 tool.

Tired of plain screenshots? Try ScreenSnap Pro.
Beautiful backgrounds, pro annotations, GIF recording, and instant cloud sharing, all in one app. Pay $39 once, own it forever.
See pricing and featuresAnnotate website pages for free with built-in tools
You may already have everything Method 3 needs.
- Microsoft Edge. Press
Ctrl + Shift + S, or right-click the page and choose Screenshot. Pick an area or the full page, then mark it up with the pen before you copy or save. Microsoft's Edge screenshot guide shows the steps. Older builds call this Web capture. - Windows Snipping Tool. Press
Win + Shift + S, select an area, and open the capture to use the pen, highlighter and shapes. The Snipping Tool guide covers each option. - macOS Markup. Press
Cmd + Shift + 4for an area orCmd + Shift + 5for the toolbar, then click the thumbnail to open Markup. Apple's screenshot help page lists every shortcut. - Safari on iPhone and iPad. Take a screenshot, tap the thumbnail, choose Full Page, then draw with Markup. Apple also documents a Share menu route that saves an annotated webpage as a PDF. The iPad screenshot guide has more.
- Firefox. Press
Ctrl + Shift + Sto save the visible area or the full page. It has no drawing tools, so annotate the file afterward. The Firefox screenshot guide has the steps. - Chrome. Chrome has no built-in drawing tool for pages. Use an extension, or grab a full-size capture in DevTools and annotate the file. The Chrome screenshot guide shows how.
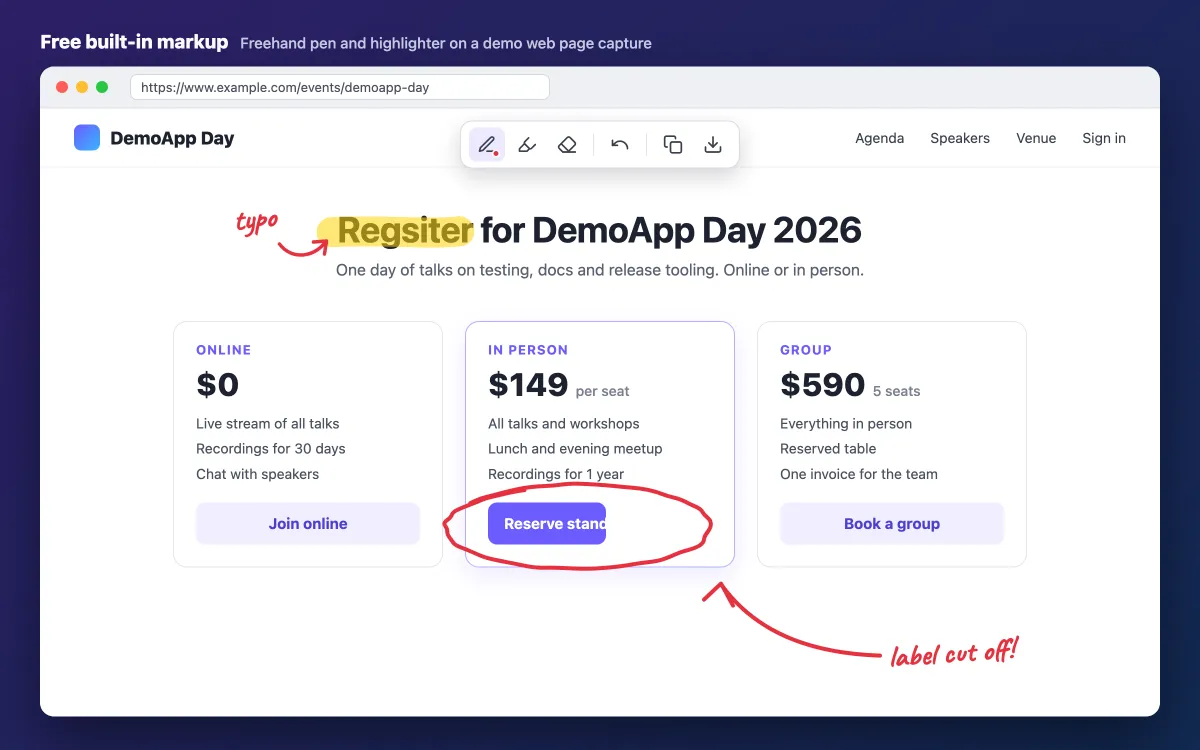
A freehand pen is fine for one quick circle. For a ticket with several issues, numbered markers and typed callouts from Method 3 read more clearly.
To mark up any of these captures without installing anything, open the free image annotation tool in your browser.
Shortcut cheat sheet
| Tool | Shortcut | Full page? | Draw or annotate? | Platform |
|---|---|---|---|---|
| Edge Screenshot | Ctrl + Shift + S | Yes | Yes, pen | Windows, Mac |
| Snipping Tool | Win + Shift + S | No | Yes, pen, highlighter, shapes | Windows 11 |
| macOS screenshot | Cmd + Shift + 4 or 5 | No | Yes, Markup | Mac |
| Safari screenshot | Top or side button + volume up (Home button on older models) | Yes, Full Page tab | Yes, Markup | iPhone, iPad |
| Firefox Screenshots | Ctrl + Shift + S | Yes | No | Windows, Mac |
| Chrome DevTools | F12, then Ctrl + Shift + P, type "full size" | Yes | No | Windows, Mac |
On a Mac, use Cmd in place of Ctrl for the Edge, Firefox and Chrome rows, and Cmd + Option + I in place of F12.
How to write website feedback people can act on
Good annotations follow a few rules:
- One issue per number. Two problems under one marker means one gets missed.
- Expected vs actual in under 15 words.
- Context in the ticket: URL, browser, viewport or breakpoint, and the time you saw it.
- Annotate the breakpoint where it breaks. A phone bug shown on a desktop capture proves nothing.
- One color, one meaning. Red for bugs, yellow for copy.
- Five to seven markers per image, at most. Split the rest into a second image.
- Crop to context, but keep a landmark like the header, so people know where they are.
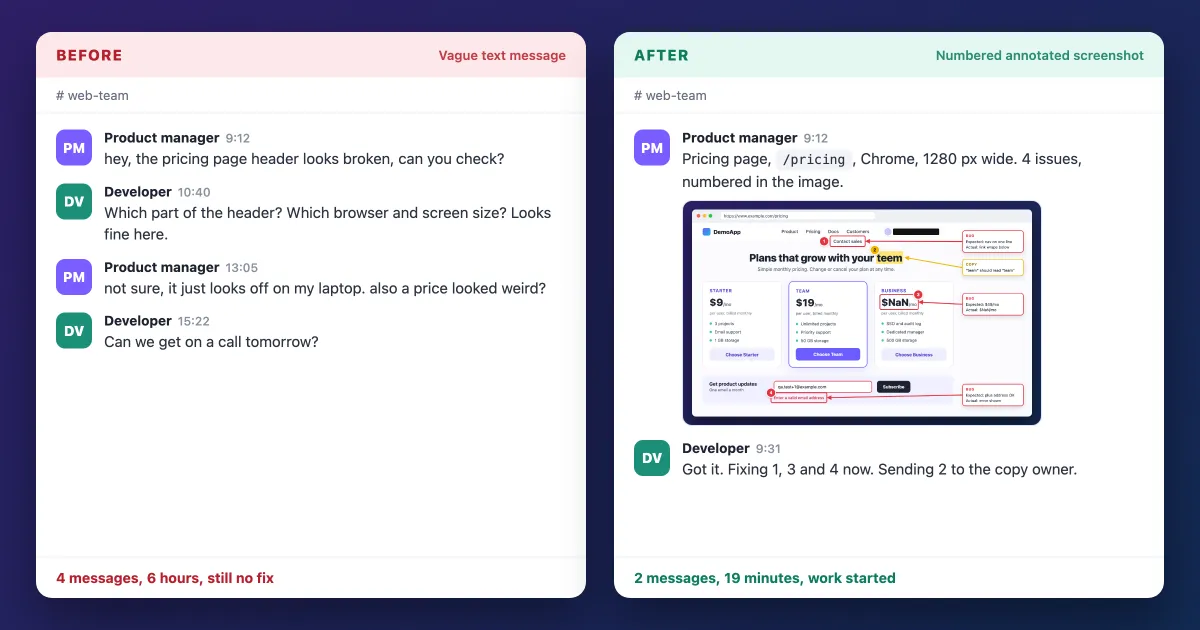
Here is a full website annotation example: ticket text that pairs with the annotated pricing page above.
**Summary:** Pricing page has 3 bugs and 1 typo
**URL:** www.example.com/pricing
**Browser and viewport:** Chrome (latest stable), macOS, 1280 x 800
**Seen:** 2026-10-05 09:12 UTC
**Issues (numbers match the image):**

1. Bug. Expected: nav on one line. Actual: "Contact sales" wraps below.
2. Copy. Expected: "team". Actual: "teem".
3. Bug. Expected: Business plan $49/mo. Actual: $NaN/mo.
4. Bug. Expected: qa.test+1@example.com accepted. Actual: "Enter a valid email address".

**Attachment:** pricing-annotated.png
For a full report with steps to reproduce, severity and logs, start from the bug report template. The same numbered format works in support tickets, GitHub issues and UAT feedback rounds.
Troubleshooting common problems
The extension icon is greyed out. Browsers block extensions on their own settings pages, on extension store pages and often in the built-in PDF viewer. Open a normal page, or save the page as a PDF and mark that up.
Highlights vanished after a page update. The text they were anchored to changed. Hypothesis lists these in an Orphans tab in the sidebar. Copy the notes you still need and re-create them on the new text.
A comment tool or URL capture shows a blank page or a login screen. The page sits behind a login, a VPN or basic auth, or it blocks framing with X-Frame-Options or CSP headers. Switch to a scrolling, region or window capture of your own logged-in browser.
Full-page capture misses images or repeats a sticky header. Lazy images only load when you scroll, and sticky headers can repeat in stitched captures. The full-page guides for Mac and Windows have fixes for both.
Cookie banners or chat widgets cover the content. Close them before a browser capture. URL captures such as ScreenSnap Pro's block most banners and ads for you.
Markers are hard to read after posting in chat. Chat apps compress images. Send a PNG captured at 2x, or attach the file instead of pasting it. If you need the text of an error from an old capture, extract the text from the image instead of retyping it.
Which method should you use?
- Notes for yourself or a class: Method 1, a highlighter extension or an annotated PDF.
- Comments from a team or client on a live build: Method 2, a pin-comment feedback tool.
- A bug ticket, change request or doc: Method 3, a capture with numbers, arrows and callouts.
Many teams use the last two side by side: Method 2 for client review rounds, Method 3 for bug tickets and technical docs.
If you file web bugs often, one app that captures the page and marks it up saves a lot of switching. ScreenSnap Pro is a one-time $39 purchase: 1 license, 2 seats (2 computers, Mac or Windows). See pricing.
Frequently Asked Questions

Morgan
Indie DeveloperIndie developer, founder of ScreenSnap Pro. A decade of shipping consumer Mac apps and developer tools. Read full bio
@m_0_r_g_a_n_